Report Toolbox
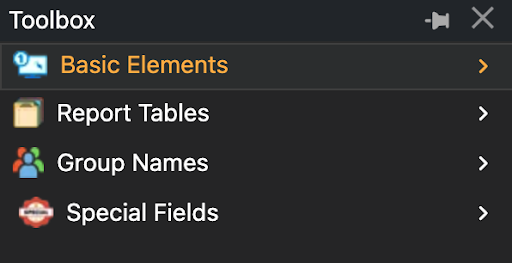
The Toolbox categorically contains all the HTML elements you can possibly add to a report. The details for each category and their corresponding sub-entities are given below:
Basic Elements
A list of elements that you can add to your reports to make it more visually appealing as well as concisely show data. To use these items, click and drag the respective item from the list on to the Canvas. The position of the tip of your mouse cursor determines the left-most, top-most position of the element. Most of these elements can be resized by dragging along the borders of the respective elements.
The items within the list are:Label
Creates a label for form elements or other content.
- Use-Cases:Labels provide context and description for associated elements.
Edit the label of the button by editing the Text field in the Attributes pane.
Edit all CSS attributes of the label in the Style field.
Horizontal Line
Creates a horizontal line to separate content.
- Use-Cases:Used for visual separation of content sections.
Edit the width of the line by editing the Width field in the Attributes pane.
Edit all CSS attributes of the line in the Style field.
Vertical Line
Creates a vertical line to separate content.
- Use-Cases: Used for visual separation of content sections.
Edit the width of the line by editing the Width field in the Attributes pane.
Edit all CSS attributes of the line in the Style field.
Box
Creates a container for design purposes.
- Use-Cases: Used wherever a rectangular design is needed.
Edit all CSS attributes of the box in the Style field.
Blocks
Creates a block-level container for content.
- Use-Cases: Blocks are versatile elements used for structuring content, creating layout sections, and applying styling or formatting.
Edit all CSS attributes of the blocks in the Style field.
Image
Creates an image placeholder on the Canvas.
- Use-Cases: Used to display visual content or graphics.
To add an image to the placeholder, click on the Src field and select the image from the file-system on your computer.
Edit the alternate text of the image by editing the Alt field in the Attributes pane.
Edit all CSS attributes of the image in the Style field.
QR Code
Embeds a Quick Response (QR) code into the document, allowing for easy scanning and access to encoded information.
- Use-Cases: QR codes are commonly used to provide quick access to websites, share contact information, or encode other data such as product details or event information.
The QR Code can be selected under the Configure the QR code for your use-cases through these settings in the Attributes pane:
FieldTableData TypeQRcode Text/codeBackgroundForegroundSizeLevel
Bar Code
Inserts a barcode into the document, encoding data in a series of parallel lines or shapes.
- Use-Cases: Barcodes are widely used for inventory management, product identification, and tracking purposes in various industries.
Configure the Barcode for your use-cases through these settings in the Attributes pane:
Barcode TextFieldTableData TypeShow TextDisplay TextBarcode FormatBarcode HeightBarcode WidthFontsizeLinecolorRotate
Report Tables
Once you start designing reports using data from the tables you uploaded through your .sql file, the tables used in the report design will be listed under this sub-menu.
Click on the + or - icon to expand the tables and list the fields in it. You can also drag one of the fields and place it on the report Canvas as a Label type element.
Group Names
Any groups you created through the Add Group are listed here.
Special Fields
A list of elements that are used to display generic, yet commonly used data, non-specific to the created reports.
Current Date:Creates a label that shows the current date on the report, according to the section in which it is placed.Full Date Time:Creates a label that shows the full date and time on the report, according to the section in which it is placed.Current Time:Creates a label that shows the current time on the report, according to the section in which it is placed.Time Zone:Creates a label that shows the current time zone on the report, according to the section in which it is placed.
Let’s dive into the steps involving report design, integration with your software application and their subsequent deployments.
types of charts
Column Chart
Displays data in vertical columns, with each column representing a category and its height proportional to the value it represents.
- Use-Cases: Column charts are effective for comparing values across different categories, showing trends over time, and highlighting differences or patterns in data.
Configure the Column chart for your use-cases through these settings in the Attributes pane:
Bar Chart
Represents data using rectangular bars with lengths proportional to the values they represent, typically oriented horizontally.
- Use-Cases: Bar charts are ideal for comparing values across different categories, displaying rankings, and visualising distributions.
Configure the Bar chart for your use-cases through these settings in the Attributes pane:
Pie Chart
Illustrates data in a circular graph, with each slice representing a proportion of the whole dataset.
- Use-Cases: Pie charts are useful for displaying percentages, showing the composition of a dataset, and highlighting relative proportions.
Configure the Pie chart for your use-cases through these settings in the Attributes pane:
Line Chart
Represents data as a series of data points connected by straight line segments, typically used to visualise trends over time.
- Use-Cases: Line charts are effective for showing trends, identifying patterns, and illustrating changes in data over continuous intervals.
Configure the Line chart for your use-cases through these settings in the Attributes pane:
Donut Chart
Similar to a pie chart, a donut chart represents data in a circular graph, but with a hole in the centre, allowing for additional information or labels.
- Use-Cases: Donut charts are useful for displaying proportions of a whole while also providing space for annotations or additional data.
Configure the Donut chart for your use-cases through these settings in the Attributes pane: